The South Atlantic Convergence Zone (SACZ) is a cloudiness zone responsible for the summer rains in most of Brazil. This zone of humidity extends from the south of the Amazon to the Center-South region.
Access our reports on rainfall in the Center-South region here.
SACZ begins to form in late spring through summer in the Southern Hemisphere, around the Equator Line. Given the evaporation of water from the Atlantic Ocean, added to the evapotranspiration of the Amazon Forest, a large amount of water is formed under this region. Due to the Earth’s rotation, this humidity “hit” the Andes Mountains and descends towards the southeast, then precipitating.
This cloudiness zone and humidity goes from the states of Santa Catarina/Paraná, to the west of Bahia and south of Piauí and Maranhão, in the north of the country. As seen on the map below.
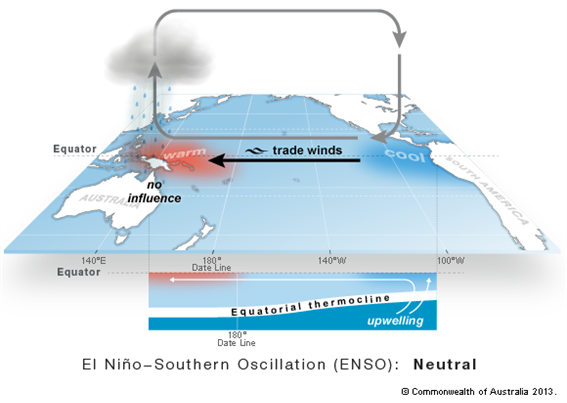
Figura 1. Faixa de nebulosidade causada pelas Zonas de Convergência do Atlântico Sul (ZCAS).
Fonte: CPTEC
This weather phenomenon occurs between spring and summer every year in South America, but other phenomena can influence its behavior.
A well-known one is the El Niño & La Niña, which occurs in the Pacific Ocean at the height of the Equator. More details can be seen by clicking here.
According to studies, in addition to El Niño & La Niña affecting the behavior of summer rainfall in Brazil, the Sea Surface Temperature (SST) of the South Atlantic also influences the SACZ.
The SST monitoring region of the South Atlantic is close to the Prata River. In the summer months, higher-than-normal SST causes the SACZ to be concentrated in the north of the Center-South region, and lower-than-normal temperatures shift the SACZ to the south of the Center-South region.
Two examples that illustrate this influence of the South Atlantic SST on the SACZ were observed in summer 2010-11 (wetter south), and summer 2011-12 (wetter north).
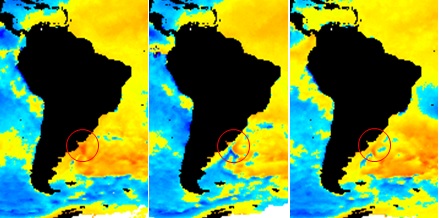
Figure 2. SST of the Atlantic South. Dec-Feb of 2010-11.
Source: National Oceanic and Atmospheric Administration (NOAA)
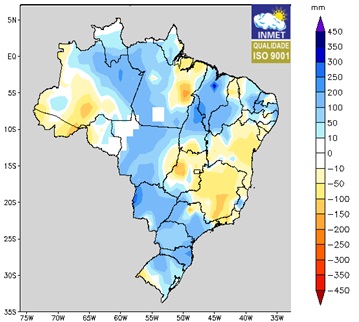
Figure 3. Observed precipitation vs climatological normal. Dec-Feb of 2010-11.
Source: INMET
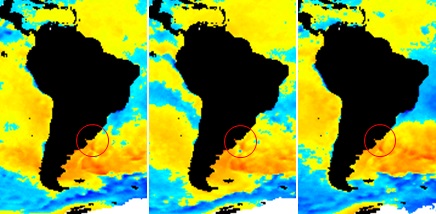
Figure 4. SST of the Atlantic South. Dec-Feb of 2011-12.
Source: National Oceanic and Atmospheric Administration (NOAA)
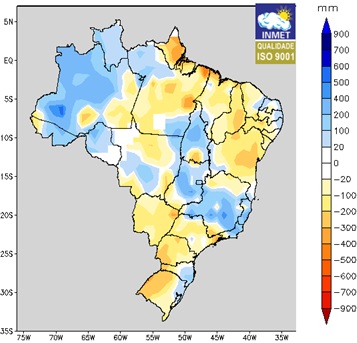
Figure 5. Observed precipitation vs climatological normal. Dec-Feb of 2011-12.
Source: INMET
Datagro monitors the rainfall behavior in the Center-South region of Brazil on a weekly basis, and it is possible to follow up on the Climate Alerts.