The climate phenomenon El Niño Southern Oscillation (ENSO) occurs in Equator Line of Pacific Ocean and affects the weather of entire Earth. This phenomenon started to be monitored by major meteorological offices of world around the 1950s. Until then, only the Peru’s fisherman in the coast, Ecuador and north of Chile followed them, in which where the sea water warmed up, occur a significant reduction in the amount of fish, and how it was more usual occur in Christmas period, the fisherman baptized of El-Niño, in reference to the birth of Jesus.
Access our El Niño & La Niña n reports here.
In normal conditions, the water surface of Pacific Ocean is hotter in the Australia and Indonesia and colder in Ecuador, Peru and Chile. When the atmosphere goes in contact with this hotter waters, turns on the environment less dense (low pressure), and the other side, with colder water, turns on more dense (high pressure). Thereby, at sea level in this zone of the Equator Line, the winds blow from east (high pressure) to west (low pressure). These winds, called trade winds, drag waters towards Australia, facilitating the outcropping of deeper and colder water (more oxygen and nutrients) in the coast of South America, given that, the fish farming is strong in this region. In addition, the fact of the Australia’s coast has low pressure, it facilitates the formation of clouds (rain), unlike the coast of Peru, where it is normally drought due to high pressure.
In the picture below is illustrated how the environment behaves under normal temperature conditions in the surface waters of the Pacific Ocean.
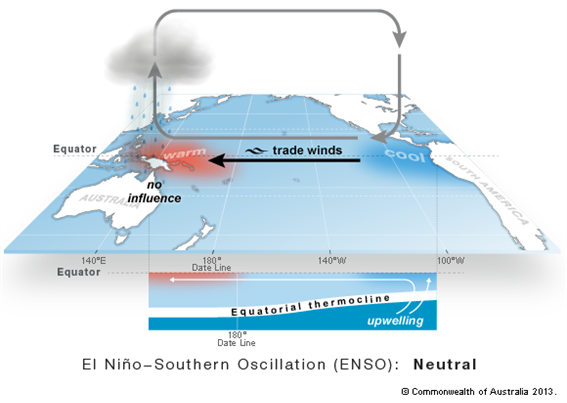
Picture 1: Normal conditions on the Equator Line.
Source: Bureau of Meteorology of Australia
For reasons until unknown, three to eight years, occur the warming of surface waters of the Pacific Ocean, close to coast of South America, called El Niño. This warming decreased the pressure in the region, weakening the trade winds of east-west, and as consequence, a reflux occurs in waters going to Australia (reduction of rainfall) to the coastal of South America (favoring the occurrence of rain) as can see on picture bellow.
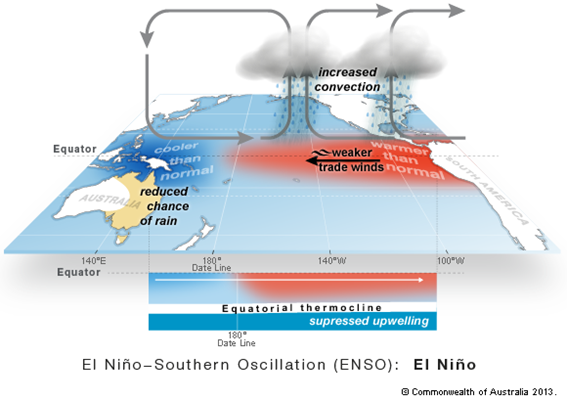
Picture 2. Favorable weather conditions to El Niño on the Equator Line.
Source: Bureau of Meteorology of Australia
To characterize an El Niño, surface waters of the Pacific Ocean, keep above +0.5°C during three consecutive months.
With the use of meteorological satellites, it was possible to verify that this climatic phenomenon not affects only the previously mentioned regions, but also in several areas of the globe, such as Southeast Asia, South Africa, United States, and some regions of Brazil.
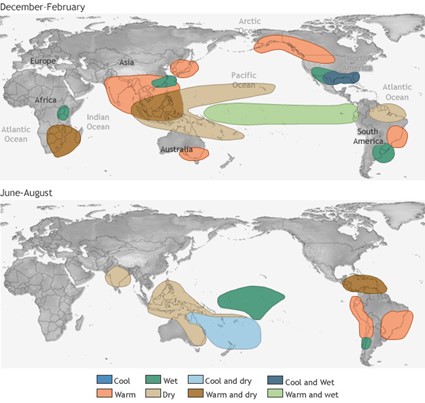
Picture 3: Consequences of El Niño on the world’s climate
Source: National Oceanic and Atmospheric Administration (NOAA)
On the other hand, La Niña is the opposite. As the waters of the Pacific Ocean surface cool down, the intensity of the trade winds is increased, where pressure in the Indonesian and Australian regions is reduced, intensifying the rainfall in these regions, as illustrated in the figure below.
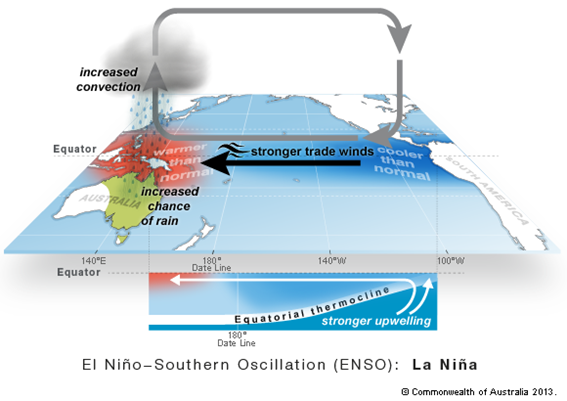
Picture 4: Favorable weather conditions for La Niña on the Equator Line.
Source: Bureau of Meteorology of Australia
To characterize the El Niña phenomenon, surface waters of the Pacific Ocean, keep bellow -0.5°C during three consecutive months.
As the phenomenon El Niño, the La Niña also affects the weather in the world, intensifying the rains and the moisture in some areas, and keep dry on the other areas, how can been see in picture below.
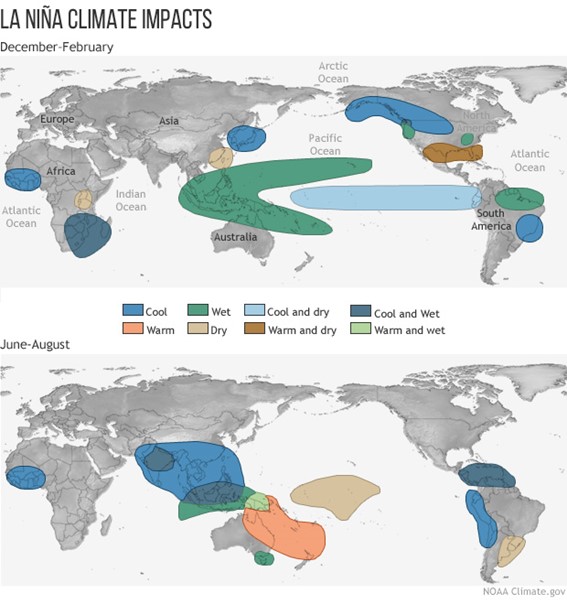
Picture 5. Consequences of El Niña on the world’s climate.
Source: National Oceanic and Atmospheric Administration (NOAA)
Besides the monitoring water surface temperature in the Pacific Ocean, other phenomenon that is monitoring to follow the El Niño & La Niña is the difference of pressure between the Tahiti and the Darwin city, in Australia. This phenomenon is called Southern Oscillation Index (SOI), which is related to the intensity of El Niño & La Niña.
Positives values of SOI indicates conditions favorable to El Niño, therefore negatives values of SOI, indicates conditions favorable to La Niña, in picture bellow is the historic values of SOI.
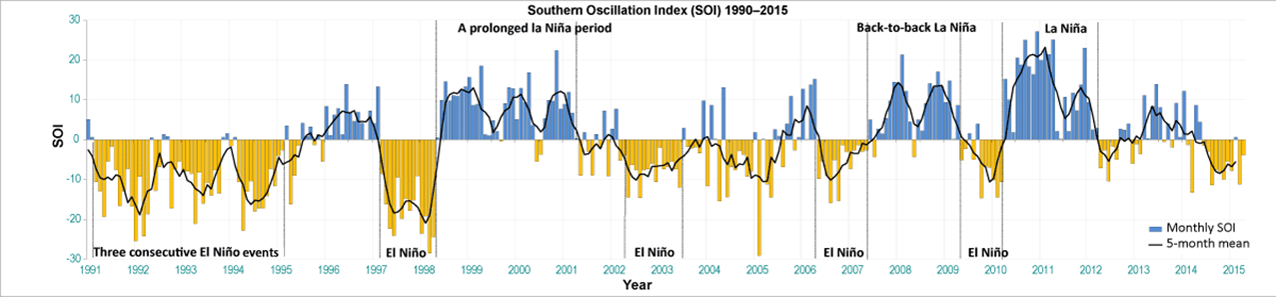
Picture 6: History of difference pressure values between Tahiti and Darwin (Australia).
Source: Bureau of Meteorology of Australia
Check here: Pacific Ocean Water Surface Temperature History
Datagro monitors the behavior of the waters of the Pacific Ocean on a monthly basis, and it is possible to follow up on the Climate Alerts